In this tutorial I’ll outline three debugging tools. You can use these tools to find the source for your games’ bugs. The first tool requires no additional installation, as it comes built-in to GBDK-2020.
The GBDK-2020 emulator debug functions.
While developing, the most effective solution is to use an emulator to test your games’ builds. The GBDK devs have created a set of functions for logging data to the emulator.
#include With that header file included, you’ll now have access to a collection of emulator debug macros. You can view the full file reference here: GBDK 2020 Docs – emu_debug.h File Reference.
The most helpful, in my opinion, is the EMU_printf macro. Which lets you log messages and variables to the debuggers console. It only supports the Emulicious debugger though. The first argument is your string message, then you can add additional arguments for variable substitutions. Here are the possible types and their placeholder values:
- %hx (char as hex)
- %hu (unsigned char)
- %hd (signed char)
- %c (character)
- %u (unsigned int)
- %d (signed int)
- %x (unsigned int as hex)
- %s (string)
For example, i can output the result of a function call:
void PlaceABlock(int16_t column, int16_t row, int16_t plane){
uint8_t someCalculatedValue = CalculateSomeValue(column,row,plane);
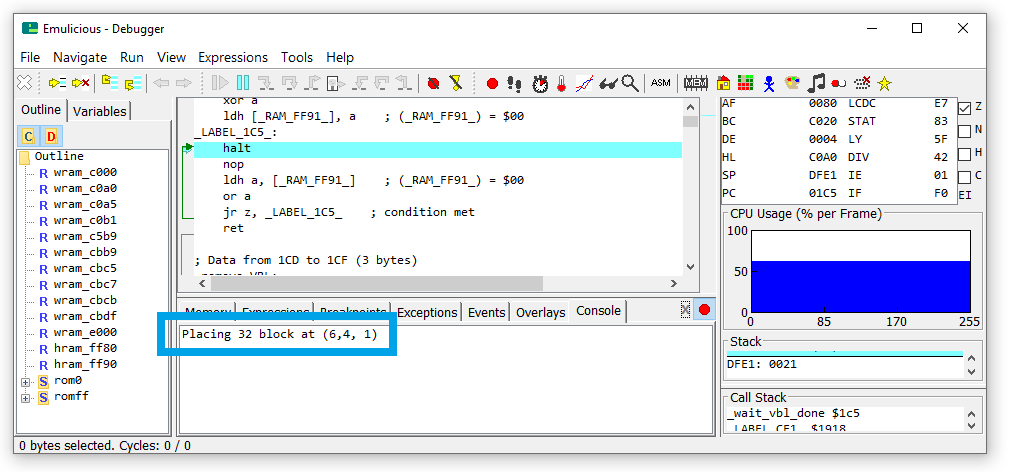
EMU_printf("Placing %d block at (%d,%d, %d)",someCalculatedValue,column,row,plane);
// do some other stuff here
}
If you open up the Emulicious debugger, you can see the message in the “console” tab:
Important Note: Too many constant calls can slow your game down. You probably only want to put in places that triggered infrequently, or by the players input.
This is a great tool for seeing what’s going on in your game’s code. The next tool will give you even greater insight into your game
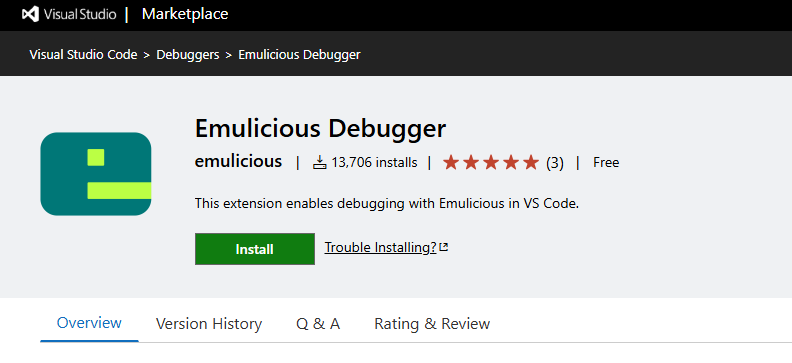
Emulicious Debugger extension for VS Code
The Emulicious team has created an extension for Microsoft’s VS Code IDE. Once installed you’ll be able to step through your game, line-by-line, and see what’s going on. you can find the extension online, or in the extension marketplace panel in the program. In the program go to the extensions view (Ctrl+Shift+X or Cmd+Shift+X on macOS), and search for “Emulicious Debugger”.
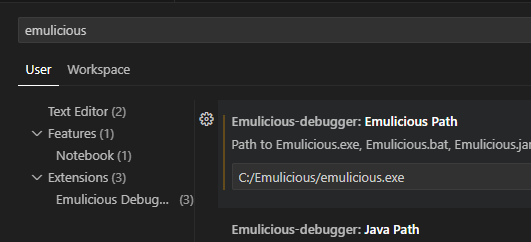
Once you have the extension installed, you should open up the preferences and specify the path to emulicious. If you don’t do this you’ll get errors later on.
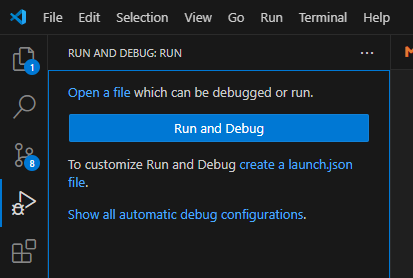
With that done, In the “Run & Debug” section of the VS code interface, click on the “create a launch.json” link. We’ll do this to create a launch configuration.
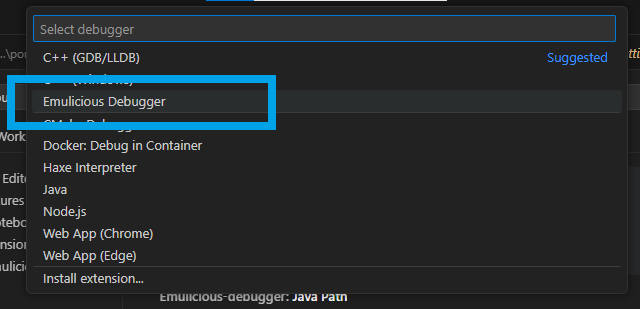
VS Code should ask you which debugger. Select “Emulicious Debugger”.
A .vscode/launch.json, should be created in your project. Update the “program” to be your compiled ROM file.
{
// Use IntelliSense to learn about possible attributes.
// Hover to view descriptions of existing attributes.
// For more information, visit: https://go.microsoft.com/fwlink/?linkid=830387
"version": "0.2.0",
"configurations": [
{
"type": "emulicious-debugger",
"request": "launch",
"name": "Launch in Emulicious",
"program": "obj/MyGameBoyProject.gb",
"port": 58870,
"stopOnEntry": true
}
]
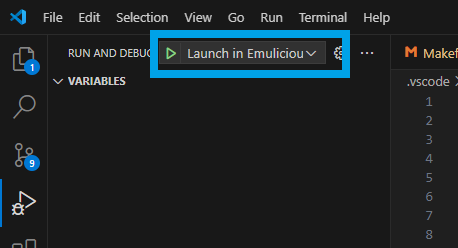
}Now, back in the “run and debug” panel, you should be able to select “Launch in Emulicious”.
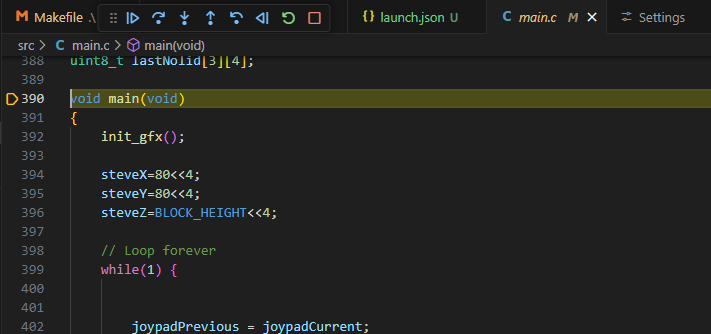
Emulicious will open up, and pause at the start of the main function.
You can use the command bar to control the debugger. The options, in order:
- Play/Continue – This will tell the debugger to let the emulator run normally. The emulator will run until it reaches a breakpoint or exception.
- Step Over – This will tell the debugger to go to the next command.
- Step into – When the debugger has selected a function, This will tell the debugger to go to the first line inside of that specified function.
- Step out – This will do the opposite of “step into”. It will tell the emulator to continue, until the current function is finished. Stopping again on the line after the function call.
- Step Back – This is the opposite of “Step over”. This will tell the emulator to go back one line.
- Reverse – This is the opposite of “Play/Continue”. This will tell the debugger/emulator to run in reverse. The emulator will run until it reaches a breakpoint or exception.
- Restart – This will restart your ROM file.
- Stop – This will disconnect the debugger.

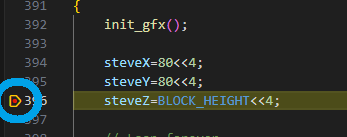
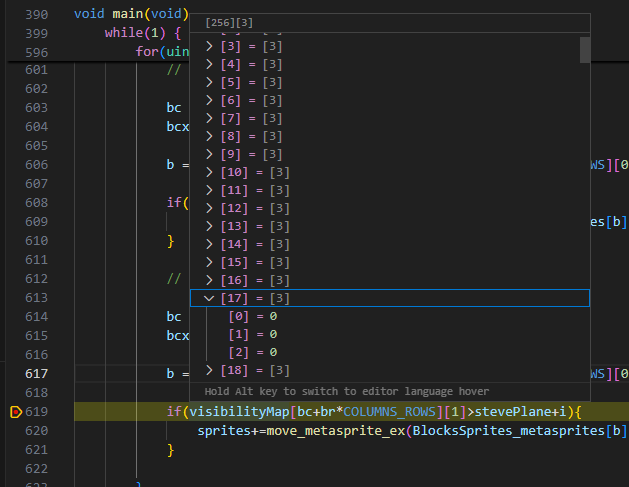
If you click to the left of the line numbers in VS Code, you can set breakpoints (visualized by little red dots). You can do this without the debugger running. however, When your debugger is connected to the emulator and running, the debugger will stop execution when it reaches a breakpoint.
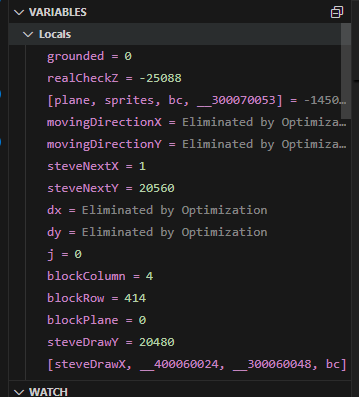
When the debugger is connected and execution is paused at a breakpoint, you can view the values of local variables. These will show up in the “variables” section of the “run and debug” panel.
You can also mouse-over variables/constants to see their current values.
That is the basics of debugging your code. This will let you understand what exactly is going on in your game.
The Romusage Executable
The final tool is simply called romusage. This is a small command line tool for estimating free space in Game Boy ROMs. This tool now comes with the GBDK-2020 as of release 4.3.0. It can also be found on Github here: RomUsage by bbbbbr.
To run the tool, you just need to pass it one of the following file types:
- .map (sdcc, rgbds)
- .noi (sdcc)
- .ihx (sdcc)
- .cdb (sdcc)
- .gb / .gbc / .pocket / .duck (ROM image file for: Game Boy / Color, Analogue Pocket, Mega Duck / Cougar Boy)
- .gg / .sms (ROM image file for: Game Gear / Sega Master System. Note: SMS/GG is GBDK-2020 specific)
Some of these will be generated when compile your ROM file. The .map and .noi files require you adding the argument “-debug” when compiling your ROM file with lcc.
Here are the basic usage documentation:
romusage input_file.[map|noi|ihx|cdb|.gb[c]|.pocket|.duck|.gg|.sms] [options]
version 1.2.9, by bbbbbr
Options
-h : Show this help
-p:SMS_GG : Set platform to GBDK SMS/Game Gear (changes memory map templates)
-a : Show Areas in each Bank. Optional sort by, address:"-aA" or size:"-aS"
-g : Show a small usage graph per bank (-gA for ascii style)
-G : Show a large usage graph per bank (-GA for ascii style)
-B : Brief (summarized) output for banked regions. Auto scales max bank
shows [Region]_[Max Used Bank] / [auto-sized Max Bank Num]
-F : Force Max ROM and SRAM bank num for -B. (0 based) -F:ROM:SRAM (ex: -F:255:15)
-m : Manually specify an Area -m:NAME:HEXADDR:HEXLENGTH
-e : Manually specify an Area that should not overlap -e:NAME:HEXADDR:HEXLENGTH
-E : All areas are exclusive (except HEADERs), warn for any overlaps
-q : Quiet, no output except warnings and errors
-Q : Suppress output of warnings and errors
-R : Return error code for Area warnings and errors
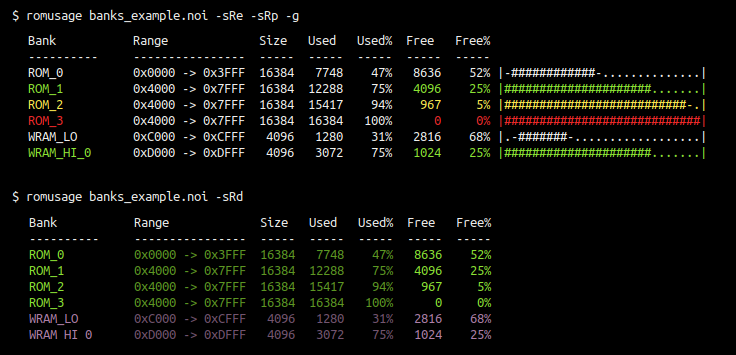
-sR : [Rainbow] Color output (-sRe for Row Ends, -sRd for Center Dimmed, -sRp % based)
-sP : Custom Color Palette. Colon separated entries are decimal VT100 color codes
-sP:DEFAULT:ROM:VRAM:SRAM:WRAM:HRAM (section based color only)
-sC : Show Compact Output, hide non-essential columns
-sH : Show HEADER Areas (normally hidden)
-smROM : Show Merged ROM_0 and ROM_1 output (i.e. bare 32K ROM)
-smWRAM : Show Merged WRAM_0 and WRAM_1 output (i.e DMG/MGB not CGB)
-sm* compatible with banked ROM_x or WRAM_x when used with -B
-sJ : Show JSON output. Some options not applicable. When used, -Q recommended
-nB : Hide warning banner (for .cdb output)
-nA : Hide areas (shown by default in .cdb output)
-z : Hide areas smaller than SIZE -z:DECSIZE
-nMEM : Hide banks matching case sensitive substring (ex hide all RAM: -nMEM:RAM)
Use: Read a .map, .noi, .cdb or .ihx file to display area sizes
Example 1: "romusage build/MyProject.map"
Example 2: "romusage build/MyProject.noi -a -e:STACK:DEFF:100 -e:SHADOW_OAM:C000:A0"
Example 3: "romusage build/MyProject.ihx -g"
Example 4: "romusage build/MyProject.map -q -R"
Example 5: "romusage build/MyProject.noi -sR -sP:90:32:90:35:33:36"
Example 6: "romusage build/MyProject.map -sRp -g -B -F:255:15 -smROM -smWRAM"
Notes:
* GBDK / RGBDS map file format detection is automatic.
* Estimates are as close as possible, but may not be complete.
Unless specified with -m/-e they *do not* factor regions lacking
complete ranges in the Map/Noi/Ihx file, for example Shadow OAM and Stack.
* IHX files can only detect overlaps, not detect memory region overflows.
* CDB file output ONLY counts (most) data from C sources.
It cannot count functions and data from ASM and LIBs,
so bank totals may be incorrect/missing.
* GB/GBC/ROM files are just guessing, no promises.Here’s an example output from the Github repo:
If you pass it a .cdb file, you can even see where your functions, constants, and variables are:
C:\path\to\my\projects\my-gameboy-project>c:/gbdk/bin/romusage obj/MyGameBoyProject.cdbWill output the following
   ************************ NOTICE ************************
    .cdb output ONLY counts (most) data from C sources.
   It cannot count functions and data from ASM and LIBs.
   Bank totals may be incorrect/missing. (-nB to hide this)
   ************************ NOTICE ************************

Bank         Range                Size     Used  Used%     Free  Free%
--------     ----------------  -------  -------  -----  -------  -----
ROM_0        0x0000 -> 0x3FFF    16384    10436    64%     5948    36%
|
| Name                            Start  -> End      Size
| ---------------------           ----------------   -----
+ main                            0x0CE1 -> 0x1920    3136
+ -?-                             0x020E -> 0x0B8D    2432
+ BlocksSprites_tiles             0x1E21 -> 0x2240    1056
+ Blocks_tiles                    0x1951 -> 0x1C70     800
+ -?-                             0x0001 -> 0x01FF     511
+ Steve_tiles                     0x26B5 -> 0x2874     448
+ init_gfx                        0x0B8E -> 0x0CE0     339
+ Blocks_map                      0x1C71 -> 0x1D30     192
+ Blocks_map_attributes           0x1D31 -> 0x1DF0     192
+ GameplayHUD_tiles               0x24E9 -> 0x2588     160
+ SelectionCursor_tiles           0x2609 -> 0x2688     128
+ -?-                             0x2481 -> 0x24E0      96
+ GameplayHUD_map                 0x2589 -> 0x25C4      60
+ GameplayHUD_map_attributes      0x25C5 -> 0x2600      60
+ BlocksSprites_palettes          0x1DF1 -> 0x1E20      48
+ Blocks_palettes                 0x1921 -> 0x1950      48
+ Steve_metasprite0               0x2875 -> 0x2888      20
+ Steve_metasprite1               0x2889 -> 0x289C      20
+ Steve_metasprite2               0x289D -> 0x28B0      20
+ Steve_metasprite3               0x28B1 -> 0x28C4      20
+ Steve_palettes                  0x26A5 -> 0x26B4      16
+ WorldIndexIsSolid               0x0200 -> 0x020D      14
+ BlocksSprites_metasprite0       0x2241 -> 0x224C      12
+ BlocksSprites_metasprite1       0x224D -> 0x2258      12
+ BlocksSprites_metasprite10      0x22B9 -> 0x22C4      12
+ BlocksSprites_metasprite11      0x22C5 -> 0x22D0      12
+ BlocksSprites_metasprite12      0x22D1 -> 0x22DC      12
+ BlocksSprites_metasprite13      0x22DD -> 0x22E8      12
+ BlocksSprites_metasprite14      0x22E9 -> 0x22F4      12
+ BlocksSprites_metasprite15      0x22F5 -> 0x2300      12
+ BlocksSprites_metasprite16      0x2301 -> 0x230C      12
+ BlocksSprites_metasprite17      0x230D -> 0x2318      12
+ BlocksSprites_metasprite18      0x2319 -> 0x2324      12
+ BlocksSprites_metasprite19      0x2325 -> 0x2330      12
+ BlocksSprites_metasprite2       0x2259 -> 0x2264      12
+ BlocksSprites_metasprite20      0x2331 -> 0x233C      12
+ BlocksSprites_metasprite21      0x233D -> 0x2348      12
+ BlocksSprites_metasprite22      0x2349 -> 0x2354      12
+ BlocksSprites_metasprite23      0x2355 -> 0x2360      12
+ BlocksSprites_metasprite24      0x2361 -> 0x236C      12
+ BlocksSprites_metasprite25      0x236D -> 0x2378      12
+ BlocksSprites_metasprite26      0x2379 -> 0x2384      12
+ BlocksSprites_metasprite27      0x2385 -> 0x2390      12
+ BlocksSprites_metasprite28      0x2391 -> 0x239C      12
+ BlocksSprites_metasprite29      0x239D -> 0x23A8      12
+ BlocksSprites_metasprite3       0x2265 -> 0x2270      12
+ BlocksSprites_metasprite30      0x23A9 -> 0x23B4      12
+ BlocksSprites_metasprite31      0x23B5 -> 0x23C0      12
+ BlocksSprites_metasprite32      0x23C1 -> 0x23CC      12
+ BlocksSprites_metasprite33      0x23CD -> 0x23D8      12
+ BlocksSprites_metasprite34      0x23D9 -> 0x23E4      12
+ BlocksSprites_metasprite35      0x23E5 -> 0x23F0      12
+ BlocksSprites_metasprite36      0x23F1 -> 0x23FC      12
+ BlocksSprites_metasprite37      0x23FD -> 0x2408      12
+ BlocksSprites_metasprite38      0x2409 -> 0x2414      12
+ BlocksSprites_metasprite39      0x2415 -> 0x2420      12
+ BlocksSprites_metasprite4       0x2271 -> 0x227C      12
+ BlocksSprites_metasprite40      0x2421 -> 0x242C      12
+ BlocksSprites_metasprite41      0x242D -> 0x2438      12
+ BlocksSprites_metasprite42      0x2439 -> 0x2444      12
+ BlocksSprites_metasprite43      0x2445 -> 0x2450      12
+ BlocksSprites_metasprite44      0x2451 -> 0x245C      12
+ BlocksSprites_metasprite45      0x245D -> 0x2468      12
+ BlocksSprites_metasprite46      0x2469 -> 0x2474      12
+ BlocksSprites_metasprite47      0x2475 -> 0x2480      12
+ BlocksSprites_metasprite5       0x227D -> 0x2288      12
+ BlocksSprites_metasprite6       0x2289 -> 0x2294      12
+ BlocksSprites_metasprite7       0x2295 -> 0x22A0      12
+ BlocksSprites_metasprite8       0x22A1 -> 0x22AC      12
+ BlocksSprites_metasprite9       0x22AD -> 0x22B8      12
+ SelectionCursor_metasprite0     0x2689 -> 0x2694      12
+ SelectionCursor_metasprite1     0x2695 -> 0x26A0      12
+ GameplayHUD_palettes            0x24E1 -> 0x24E8       8
+ SelectionCursor_palettes        0x2601 -> 0x2608       8
+ -?-                             0x26A1 -> 0x26A4       4

ROM_255      0x4000 -> 0x7FFF    16384     4984    30%    11400    70%
|
| Name                            Start  -> End      Size
| ---------------------           ----------------   -----
+ MainMenu_tiles                  0x4A48 -> 0x50A7    1632
+ InventoryScreen_tiles           0x44D0 -> 0x476F     672
+ ChestScreen_tiles               0x4008 -> 0x41F7     496
+ ChestScreen_map                 0x41F8 -> 0x435F     360
+ ChestScreen_map_attributes      0x4360 -> 0x44C7     360
+ InventoryScreen_map             0x4770 -> 0x48D7     360
+ InventoryScreen_map_attributes  0x48D8 -> 0x4A3F     360
+ MainMenu_map                    0x50A8 -> 0x520F     360
+ MainMenu_map_attributes         0x5210 -> 0x5377     360
+ ChestScreen_palettes            0x4000 -> 0x4007       8
+ InventoryScreen_palettes        0x44C8 -> 0x44CF       8
+ MainMenu_palettes               0x4A40 -> 0x4A47       8

WRAM_LO      0xC000 -> 0xCFFF     4096     3018    74%     1078    26%
|
| Name                            Start  -> End      Size
| ---------------------           ----------------   -----
+ -?-                             0xC5B9 -> 0xCBC8    1552
+ blocks                          0xC0B9 -> 0xC5B8    1280
+ -?-                             0xC001 -> 0xC0B8     184
+ __EMU_PROFILER_INIT             0xCBC9 -> 0xCBCA       2


   ************************ NOTICE ************************
    .cdb output ONLY counts (most) data from C sources.
   It cannot count functions and data from ASM and LIBs.
   Bank totals may be incorrect/missing. (-nB to hide this)
   ************************ NOTICE ************************
This is a great tool for identifying where certain data is. How much data is in given banks, and how much data/space you have left.
Conclusion
That’s it for this tutorial. Next time you run into problems, try these 3 tools out. I also have a tutorial about common GBDK Errors, and their solutions. You can read that here: Troubleshooting common GBDK-2020 Errors